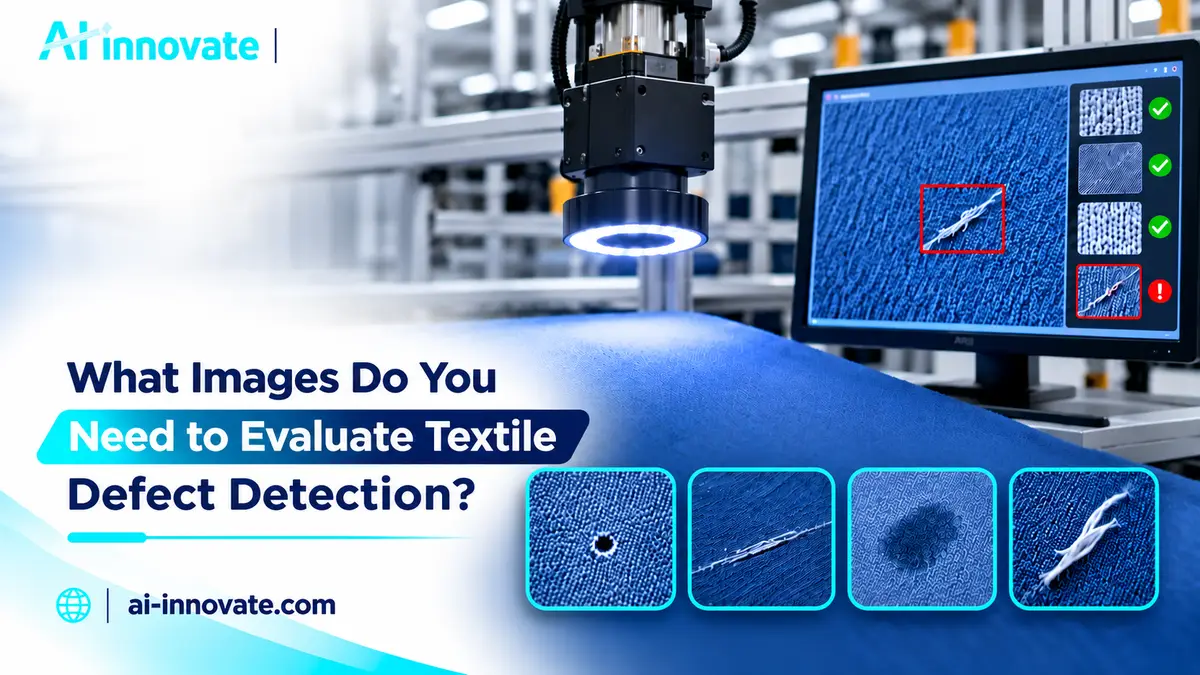
The images needed for textile defect detection at the feasibility stage are the ones that show your fabric as it really runs: acceptable fabric, each defect you care about, the cases your inspectors argue over, and the normal variation between batches, colors and patterns. A handful of random photos cannot stand in for them, and neither can a public dataset or a fixed image count.
For the quality, technical and operations managers involved, and the textile engineer running the evaluation, the practical questions are which samples to collect, what information to send with them, and how much an image-based screening can prove. A sample set built around those questions shows whether the defect can be seen in images at all, and it makes clear which questions still need validation on the production line.
Start with Acceptable and Defective Samples
A sample here means a piece of fabric chosen to represent one case, and the images are pictures of those samples. An initial screening usually starts with images. Physical samples matter later, when imaging is tested under controlled light.
Begin with two groups: fabric your quality team accepts and fabric it rejects. The acceptable group shows what normal looks like, and the defective group shows what the system has to find. An evaluation that has only one of the two cannot tell whether a defect stands out from the fabric around it. Take representative defect samples from normal production where you can. A defect made on purpose, such as a cut to imitate a hole, may not look like the real one.
Which group matters more depends on the AI method used. Some methods learn from examples of marked defects, and others learn mainly from defect-free fabric [1]. Either way, defective samples are needed, because without them nobody can check whether the method finds the defects that matter.
Label every defective sample with three facts:
Defect type: use the names your quality team already uses, ideally matched to standard terminology for fabric defects [2].
Position: where the defect sits across the width, how far it is from the edge, and which face of the fabric shows it.
Size or severity: how long or large it is, and whether it would be rejected, downgraded or accepted.
Size deserves care because it often decides the grade. In the four-point system, penalty points rise with defect length [3], so a sample set that shows each defect at several sizes says more than one that shows only the most obvious cases.
There is no universal number of images that fits every defect and every line. A useful set has enough acceptable fabric to show its normal range, and enough examples of each target defect to show it at the sizes and positions that matter.
Figure 1. Four sample groups for an initial evaluation, with the label each one needs. Simplified illustration, not real samples or results.
Which Production Variations Should Your Images Represent?
Production variation images for textile inspection should cover what your line produces in normal operation, and only the variation that matters for the defects you want to find. Typical candidates are:
Color and shade range of the fabric, if more than one color runs on the line.
Pattern: stripes, checks or designs, including a full pattern repeat.
Texture and construction: weave or knit structure, weight and surface finish.
Material: fiber or yarn changes that alter how the fabric looks.
Production batch: acceptable fabric from more than one batch or lot.
Natural variation that your quality team accepts, such as slight density or appearance differences.
Variation matters because AI models can perform worse on fabric they have not seen. In a study of 38 woven, patterned fabrics, a model scored 95.2 on fabrics it had seen in training and an average of 85.6 when each fabric was held out of training in turn, with wide differences between fabrics [4]. The score is AUPR, which summarizes missed defects and false alarms across all detection thresholds, and higher is better.
Imaging conditions are part of the variation as well. A dataset recorded on circular knitting machines covers different fabric types, production speeds and lighting conditions, because, as its authors note, earlier fabric datasets did not reflect the variation of real production [5].
When the fabric type itself changes, new samples are only part of the work. The inspection changes for different fabric types include lighting, fabric handling and acceptance limits.
How Should Borderline or Ambiguous Defects Be Handled?
If your operators disagree about whether a sample should pass, the evaluation has no reliable answer to score against. Settle the rule first, then image the samples.
Human inspection decisions are less reliable than they look. In a study of 82 inspectors checking 140 precision-manufactured parts, inspectors correctly rejected 85% of defective items and also rejected 35% of acceptable parts [6]. The parts were not textiles, but the result shows that trained inspectors make both kinds of error: they miss defects and they reject good parts.
The grading rule itself also changes the result. The standard test methods for visually inspecting and grading fabrics note that the penalty points for the same rolls or bolts of fabric may vary considerably depending on which of the standard’s grading options is used [7].
For borderline cases, prepare three things:
A written acceptance rule: what is accepted, what is rejected and what goes to review, in the terms your customers and inspectors use.
Borderline samples: a few cases that sit near the limit, kept separate from the clear accept and reject groups.
A recorded decision: the quality team or a technical expert decides each borderline sample and notes the reason.
Keep the decision with the image. Marking that decision in the image is part of surface defect image annotation, a separate step after the samples are chosen.
Why Isn’t a Public Fabric Defect Dataset Enough for Your Line?
A public textile defect detection dataset is built to compare methods. Whether your own fabric can be inspected is a separate question. The AITEX fabric database, for example, contains 245 images of seven plain fabric structures with 12 defect types, recorded at one production plant, and was published so that researchers could compare detection methods directly [8]. Its authors note that the distribution of defects may differ in plants that use other yarns and weaves.
Researchers who recorded the LUSITANOv2 dataset at an active textile inspection station note that laboratory-oriented datasets do not capture fabric motion, changing material programs, illumination effects or line-scan geometry, and that strong results on a laboratory dataset should not automatically be taken as evidence that a model will work in production [1].
Their transfer tests show how far results can drop when the data changes. A model trained on LUSITANOv2 lost 94% and 96% of its detection score when tested on two other public fabric datasets, and models trained on those datasets also performed poorly on LUSITANOv2 [1]. The same authors state that their own dataset, recorded at a single site, cannot establish how a model will perform in other factories, cameras or lighting systems.
A public dataset can still help you understand defect types and how they appear in images. For a feasibility decision, the fabric defect images for AI inspection have to come from your own production.
What Production Context Should Accompany the Images?
Textile inspection image data is hard to judge without context. Send these details with your samples:
Fabric or material: construction, fiber, color range and finish.
Production stage: where the defect is created and where it first becomes visible, such as weaving, knitting, dyeing, printing or finishing.
Defect description: type, typical size, how often it occurs and why it leads to rejection or downgrading.
Current inspection: how the fabric is inspected today, at which point, and against which criteria.
Visibility conditions: current lighting, line speed range, fabric width and any movement or vibration at the inspection point.
How the images were taken: device, distance, lighting and resolution, so the screening can tell what comes from the photo setup and what comes from the fabric.
AI-Innovate asks for the same kind of information when it screens textile inspection applications: representative images, acceptable examples, examples that show the quality issue, material information, the production stage and a short defect description.
What Can Representative Images Tell You, and What Can’t They Tell You?
Representative images answer the first feasibility question for machine vision: can the defect be seen and told apart from acceptable fabric in an image? They can also show which defects or variations are hard to separate, and whether the image needs more detail. In the LUSITANOv2 study, keeping more of the native weave detail improved detection [1], so image resolution is one of the things a screening can reveal.
Still images cannot prove how the inspection will behave on a running line. They do not show fabric motion, line speed, vibration, the geometry of a line-scan camera, or light that changes during a shift. They also cannot show how often good fabric is flagged over long production runs, or how the system handles defects that were not in the sample set. Lighting alone can change the result: in a dataset recorded on circular knitting machines, models scored an average F1 of 86.84% when the test images were captured at a speed and lighting comparable to the training images, and 48.93% when only the lighting changed [5]. F1 combines missed defects and false alarms into one score, and higher is better.
For this reason, AI-Innovate describes its Smart Demo as an initial image-based screening. It is not connected to the production line, so it does not guarantee production performance or replace validation under real production conditions. If the screening looks promising and the goal is automated visual inspection on the line, the next step is a full demo, a technical assessment or a pilot, depending on how mature the project is.
What Should You Prepare for an Initial Evaluation?
Before you share images or samples, check that you have:
Acceptable samples across the normal range of the fabric.
Defective samples of each target defect, labeled by type, position and size.
Borderline samples, if you have them, with the quality team’s decision and reason.
Relevant variation: the colors, patterns, textures, materials and batches that run on the line.
Production context: fabric, production stage, defect description, current inspection and visibility conditions.
Your acceptance rule: what is accepted, rejected or sent to review.
If something on the list is missing, such as borderline samples or a second batch, mention it when you share the images, so the screening result is read with that gap in mind.
Share images of acceptable, defective and, if you have them, borderline samples of your fabric, together with the production context and your acceptance rule. AI-Innovate will screen whether the defect can be seen in images and recommend the next step. No detection accuracy, speed or production result is promised before testing.
How many images do we need to start evaluating a textile defect?
There is no fixed number that fits every defect and line, and reported results depend heavily on the dataset used [1]. The set should cover the normal range of your acceptable fabric and show each target defect at the sizes and positions your quality team cares about. Subtle defects and fabric that varies a lot generally need more examples than obvious defects on uniform fabric.
Do we need both acceptable and defective fabric examples?
Yes. Acceptable examples show the normal range of the fabric, and defective examples show what the inspection has to find. Some methods can learn from acceptable fabric alone [1], but defective examples are still needed to check that the defects you care about are found.
Can mobile photos be used for an initial Smart Demo?
They can help with a first look at whether a defect is visible, if the photos are sharp, evenly lit, taken close enough to show the fabric structure, and taken the same way for acceptable and defective samples. A published dataset of knitted fabric faults was built from smartphone photos collected at several knit dyeing plants [3]. Phone photos do not show how a camera on the line will see the fabric, so the result is a starting point only.
Can a public fabric defect dataset validate our production line?
No. A public dataset can show how defects appear in general, but it does not reflect your fabric, imaging system, lighting or line conditions [1].
References & Sources
Carrilho, R., Rashidunnabi, M., Proença, H. LUSITANOv2: A Real-World Dataset for Fabric Defect Detection in Active Textile Production. Electronics, 15(19), 4403, 2026. doi:10.3390/electronics15194403
ASTM International. ASTM D3990-12(2020), Standard Terminology Relating to Fabric Defects. Standard page
Das Gupta, A., Sadek, Z., Hossain, M.S., Toha, T.R., Mondol, A., Habiba, S.U., Alam, S.M.M. An approach to automatic fault detection in four-point system for knitted fabric with our benchmark dataset Isl-Knit. Heliyon, 10(17), e35931, 2024. doi:10.1016/j.heliyon.2024.e35931
Rippel, O., Zwinge, C., Merhof, D. Increasing the Generalization of Supervised Fabric Anomaly Detection Methods to Unseen Fabrics. Sensors, 22(13), 4750, 2022. doi:10.3390/s22134750
Ni, Y.-Q., Huang, P.-K., Wang, W.-J., Liang, D., Lin, C.-Y. TSFabrics: A Time-Series Fabric Dataset for Real-Time Defect Detection on Circular Knitting Machines. Scientific Data, 13, 379, 2026. doi:10.1038/s41597-026-06748-9
See, J.E. Visual Inspection Reliability for Precision Manufactured Parts. Human Factors, 57(8), 2015, pp. 1427 to 1442. doi:10.1177/0018720815602389
ASTM International. ASTM D5430-26, Standard Test Methods for Visually Inspecting and Grading Fabrics. Standard page
Silvestre-Blanes, J., Albero-Albero, T., Miralles, I., Pérez-Llorens, R., Moreno, J. A Public Fabric Database for Defect Detection Methods and Results. Autex Research Journal, 19(4), 2019, pp. 363 to 374. doi:10.2478/aut-2019-0035
About the author and reviewer
Written by
Mehdi Sanjari
Mehdi Sanjari, PhD, PEng, is an AI entrepreneur and CEO of AI-innovate, specializing in AI, machine learning, and product innovation.
PhD candidate researching AI-driven manufacturing optimization, applying machine learning and big data to improve sustainability, efficiency, and quality in advanced materials processing.